
SPX-Based Pseudo Firm
Consider a pseudo firm that purchases the S&P 500 (SPX) index by issuing equity and a zero-coupon bond with face value K and maturity T.
Bond holders have a payoff at time T equal to
Payoff Bond Holders = min(A(t), K) = K - max(K-A(t), 0)where A(t) = SPX index at t. The payoff profile is the following:
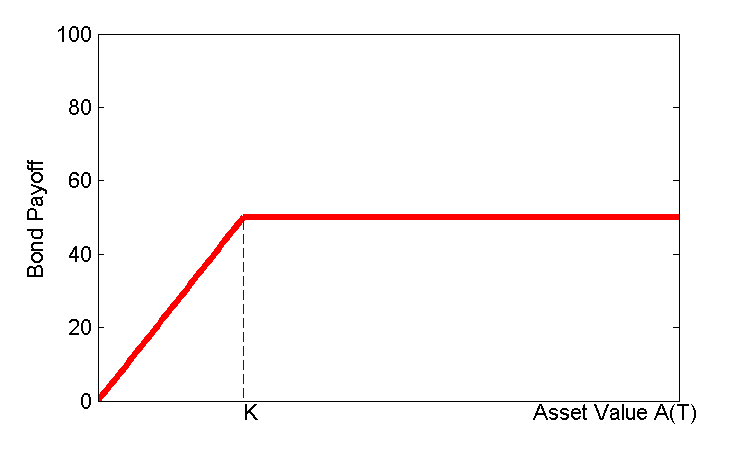
The value of the zero coupon bond “issued” by such firm is B(t,T) = KZ(t,T) - PSPX(K,t,T) where
- Z(t,T)= price of a Treasury zero coupon bond;
- PSPX(K,t,T)= price of a put option on the SPX index
Above, E(t) stands for equity value, which in this framework can be computed as a residual from the accounting identity Assets = Liabilities.
Application: Two SPX-Based Pseudo Firms during the Financial Crisis
(from Culp, Nozawa, Veronesi (2015)):
Let t = June 29, 2007. We had the following data- SPX index A(t) = 1503.35;
- Put options with maturity T = Dec 19, 2009 and strike prices K1 = 800 and K2 =1150
- PSPX(800,t,T) = $4.7;
- PSPX(1150,t,T) = $30.15;
- Treasury zero-coupon bond Z(t,T) = $88.81
- Low leverage pseudo firm: Initial leverage L1(t)=K1/A(t)=800/1503.35=53%;
- Bond price (for 100 principal): B1(t,T) = $88.22;
- Credit spread: cs1(t,T) = 0.27%.
- High leverage pseudo firm: L2(t) =1150/1503.35=76%.
- Bond price (for 100 principal): B2(t,T) = $86.19;
- Credit spread cs2(t,T) = 1.24%.
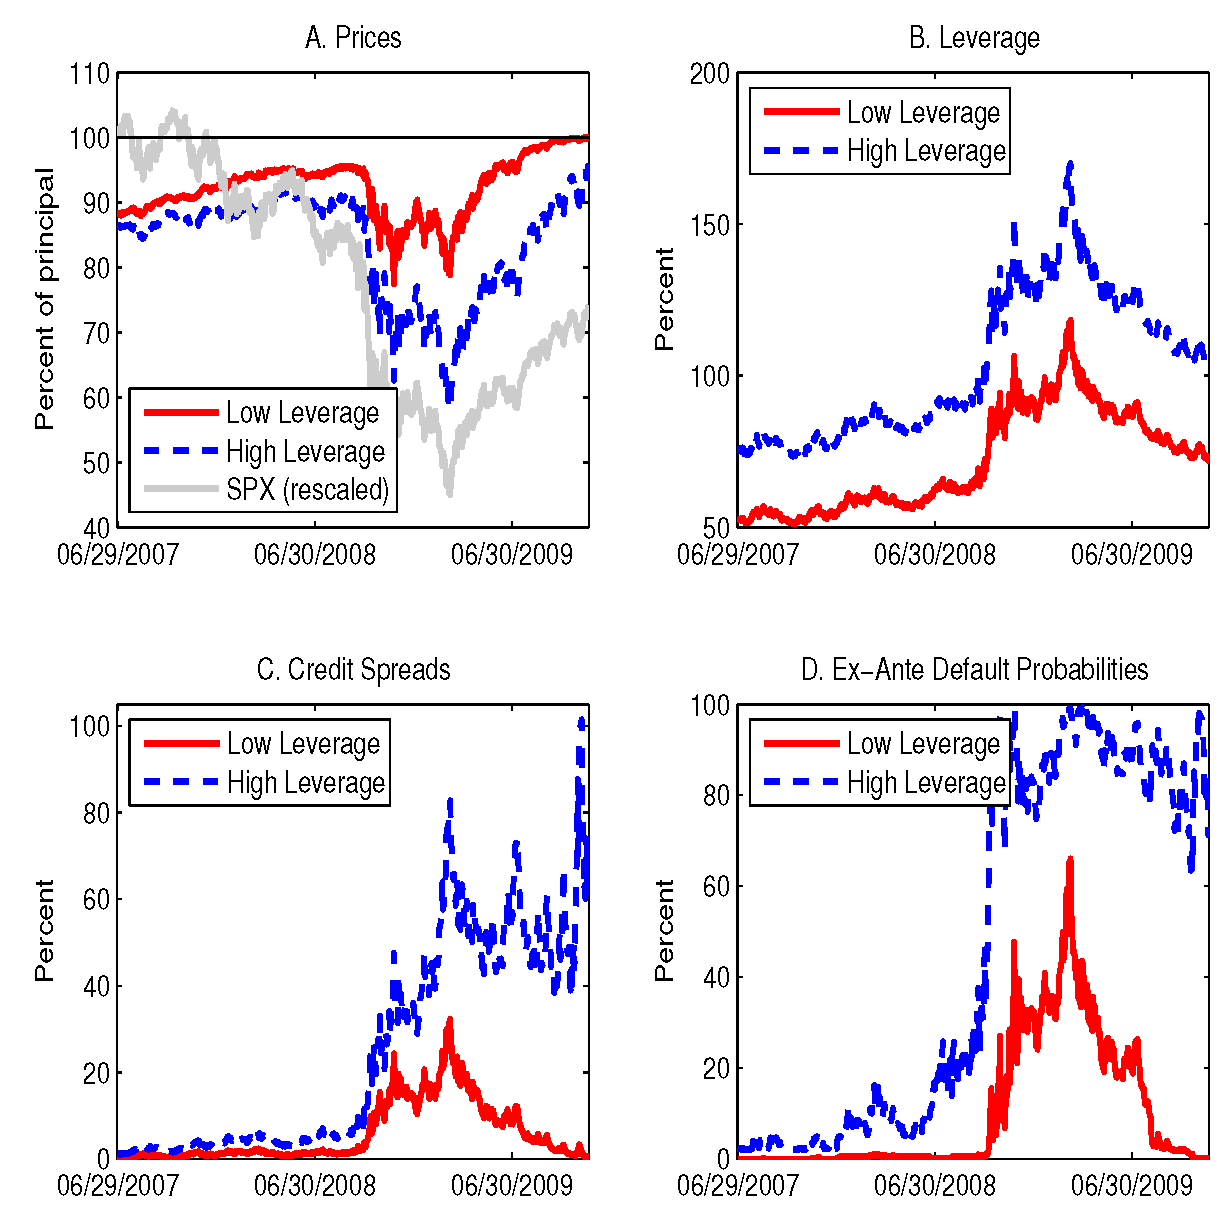
The panels in this figure plot the following quantities:
- Panel A plots the prices of the low leverage and the high leverage pseudo bond from June 2007 to November 2009, along with the (rescaled) SPX index. The low-leverage pseudo bond price steadily increases over time -- like any zero-coupon bond -- except during the 2008 crisis, when it drops substantially. Still, this pseudo bond eventually pays 100\% of principal at maturity. The pseudo bond issued by the high-leverage firm instead displays a larger price drop during the financial crisis, which never fully recovers. This pseudo firm eventually defaults and bond holders would only receive the ``recovery amount'' A(T)/K2 = 95% of principal value.
- Panel B plots their leverage ratios, which increase dramatically during the financial crisis.
- Panel C plots the credit spreads of the two pseudo bonds. The high-leverage pseudo bond always has a higher credit spread than the low-leverage pseudo bond. Both credit spreads are low initially but increase during the financial crisis. The credit spread of the low-leverage pseudo bond then converges back to a negligible number by the end of the sample, whereas the high-leverage pseudo bond displays credit spreads of over 80% as it nears maturity.
- Panel D plots the probabilities of default of the two SPX pseudo bonds. The high-leverage pseudo firm has higher default probability than the low-leverage pseudo firm, which is not surprising because both pseudo firms have the same underlying assets, the SPX. Both default probabilities increased during the financial crisis, with the high-leverage pseudo bond jumping to almost 100% and hovering around that value up to maturity. The default probability of the low-leverage bond returned to zero by maturity, as it became clear that no default would occur.