
Pseudo Banks and Default Risk in Banking
Pseudo firms can be profitably used to study questions related to the credit risk of banks. We can imagine a pseudo bank, that does not exist, that makes corporate loans to pseudo firms, that also do not exist in reality. This is an experiment to use pseudo bond data to study questions other than their credit spreads.
Next figure, taken from Figure 5 of Culp, Nozawa, Veronesi “Option-Based Credit Spreads” (2015), illustrates the hypothetical setting:
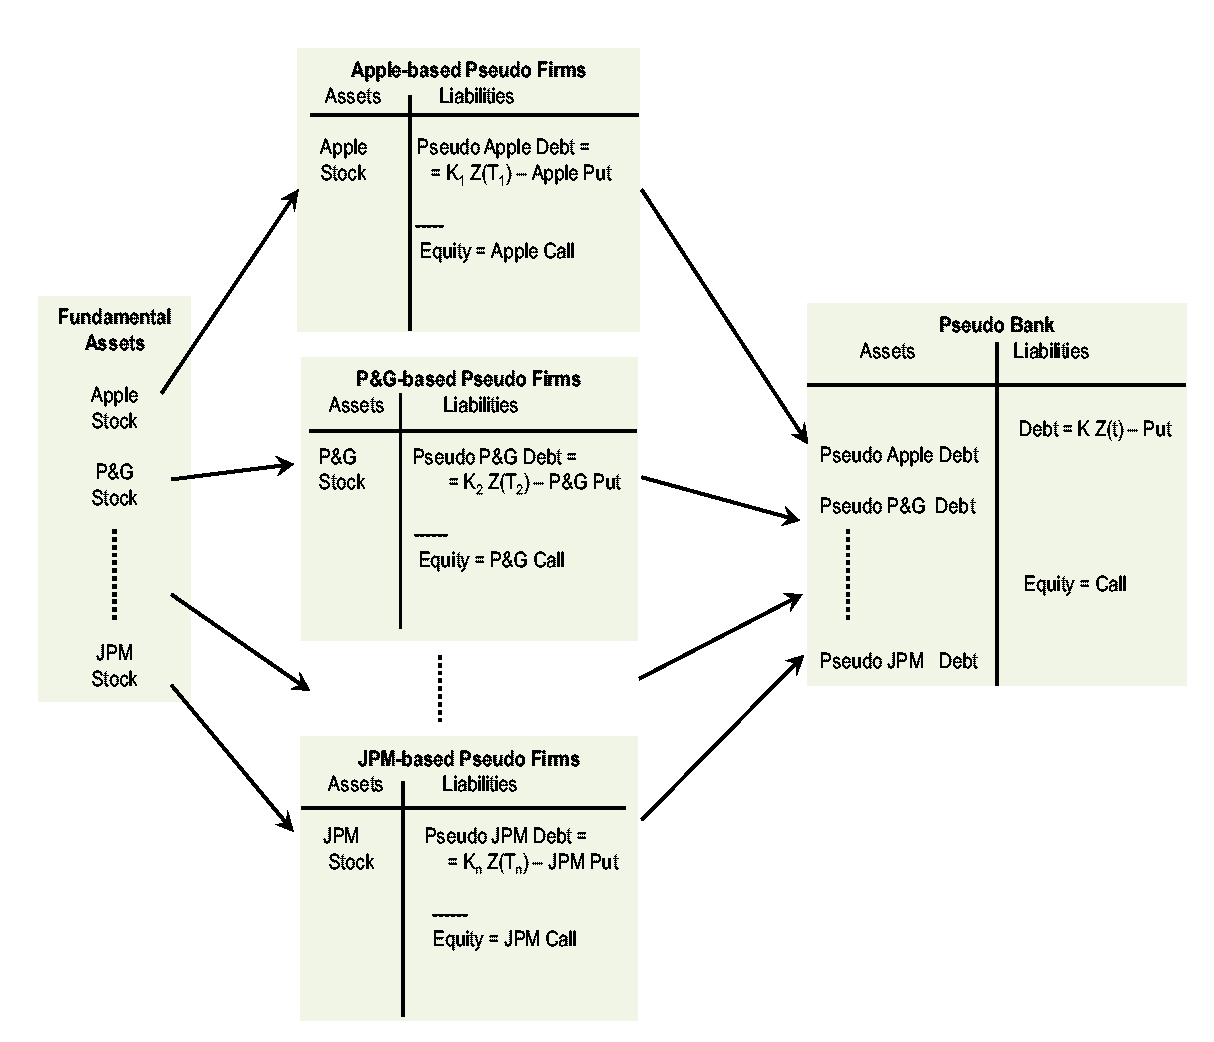
In the figure:
- Left: the set of pseudo firms' assets, namely, the stocks of the firms comprising the SPX index;
- Middle: single-stock pseudo firms with assets equal to individual stocks’ shares, and liabilities given by Treasuries minus put options on underlying stocks;
- Right: a hypothetical pseudo bank, whose assets are the pseudo firms' bonds.
We can thus compare shocks to fundamental assets, on the left-hand-side of the figure, to shocks to the pseudo bank's assets, on the right-hand-side of the figure. All of these shocks are empirical and observable to us, because we can observe returns on individual stocks and returns on pseudo bonds, and thus the portfolio of the pseudo bank.
This “experiment” allows us to gauge the size of the amplification effect of leverage on the riskiness of the (pseudo) bank. In particular, we can
- Compare fundamental shocks to pseudo bank shocks (they are all observable);
- Measure the size of the tails of the pseudo bank’s assets;
- Consider different banks that make loans to the various pseudo firms, and measure the correlation across banks.
Consider the simple experiment carried out in Culp, Nozawa, and Veronesi (2015). For every month t, CNV randomly select pseudo bonds “issued” by the individual firms that comprise the S&P 500 index to be part of the assets of the pseudo bank. The pseudo bank only makes one loan per pseudo firm. For every t, given the random portfolio, CNV can compute the return of such portfolio using actual pseudo-bond data. Such random assignment of single-stock pseudo bonds to the assets of the pseudo bank is performed 1000 times for every month, and the procedure is repeated for every month from 1996 to 2014. The outcome of the procedure is a distribution of pseudo banks’ asset returns. Because the simulation of random portfolios is performed 1000 times, the outcome can also be interpreted as the distribution of 1000 different (random) banks. Note that only the portfolio is randomized, but the returns are actual realized returns in the data.
For comparison, CNV also computes the distribution of corresponding distribution of fundamental shocks. That is, in the banking Figure about CNV relates the returns to the underlying assets on the far left with the returns to the bank assets on the far right. The result of this experiment in contained in the following figure, in which we assume the pseudo banks' portfolios of loans are equally balanced of IG and HY firms.
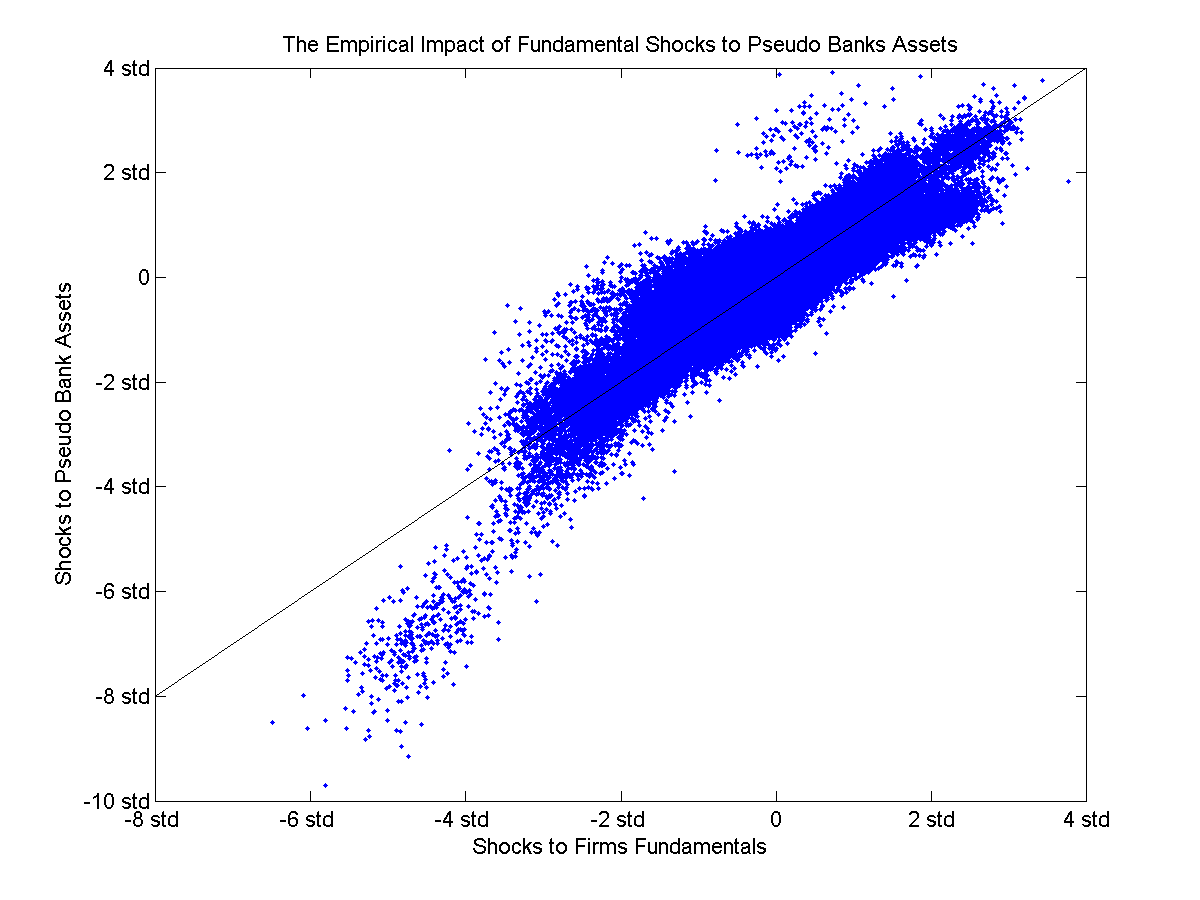
The x-axis reports the standardized returns of the assets owned by the pseudo firms (far left of banking figure above). Economically, these are then "fundamental shocks" that we can observe. The y-axis reports the corresponding standardized returns of the bank’s assets (far right of the banking figure above).
The figure clearly shows far fatter tails of the distribution of the pseudo bond portfolio returns compared to the underlying fundamental assets. For instance, a three standard deviation shock to fundamental assets can easily bring about a five or even six standard deviation shock to bank’s assets (portfolio of pseudo bonds), and five standard deviation fundamental shock can bring about an eight or more standard deviation shock to the bank’s assets. CNV discusses the source of such amplification effect and the likely source of the fatter tails.
Finally, interpreting the 1000 simulations of random bank portfolios as corresponding to 1000 banks making loans to the single-stock pseudo firms, we see from the figure a clustering of large losses that occur on the same date. For instance, the mass of points in bottom left corner is just due to one month, October 2008. One interpretation is then that a large number of the 1000 random pseudo banks that made loans on that month would have suffered severe losses, an indication of systemic risk.
All of these results are of course only hypothetical, which is exactly the nature of using pseudo firms, and in this case pseudo banks, to learn about the source of credit risk using simple firms.