
SPX-Based Credit Spread Indices
We exploit the highly liquid options on SPX to set up new credit spread benchmark indices. We provide herein a summary of the methodology. See Culp, Nozawa, Veronesi “Option-Based Credit Spreads”, November 2015 , for details. Data are from MDR and OptionMetrics.
For every month from 1990 to 2014, we consider the universe of available put options on the SPX, process the data through batteries of filters to obtain reliable quotes, and for each "pseudo bond" corresponding to each strike price, we compute a default probability, as illustrated in Culp, Nozawa, and Veronesi (2015). Given the default probabilities, we assign the bonds to two categories: Investment Grade (IG) and High Yield (HY). IG pseudo bonds are those with very low default probability. For each month, we then take the average of credit spreads for each category. See Culp, Nozawa, and Veronesi (2015) for further details.
The following figure is a modified version of Figure 4 of Culp, Nozawa, Veronesi (2015). The index data are available here .
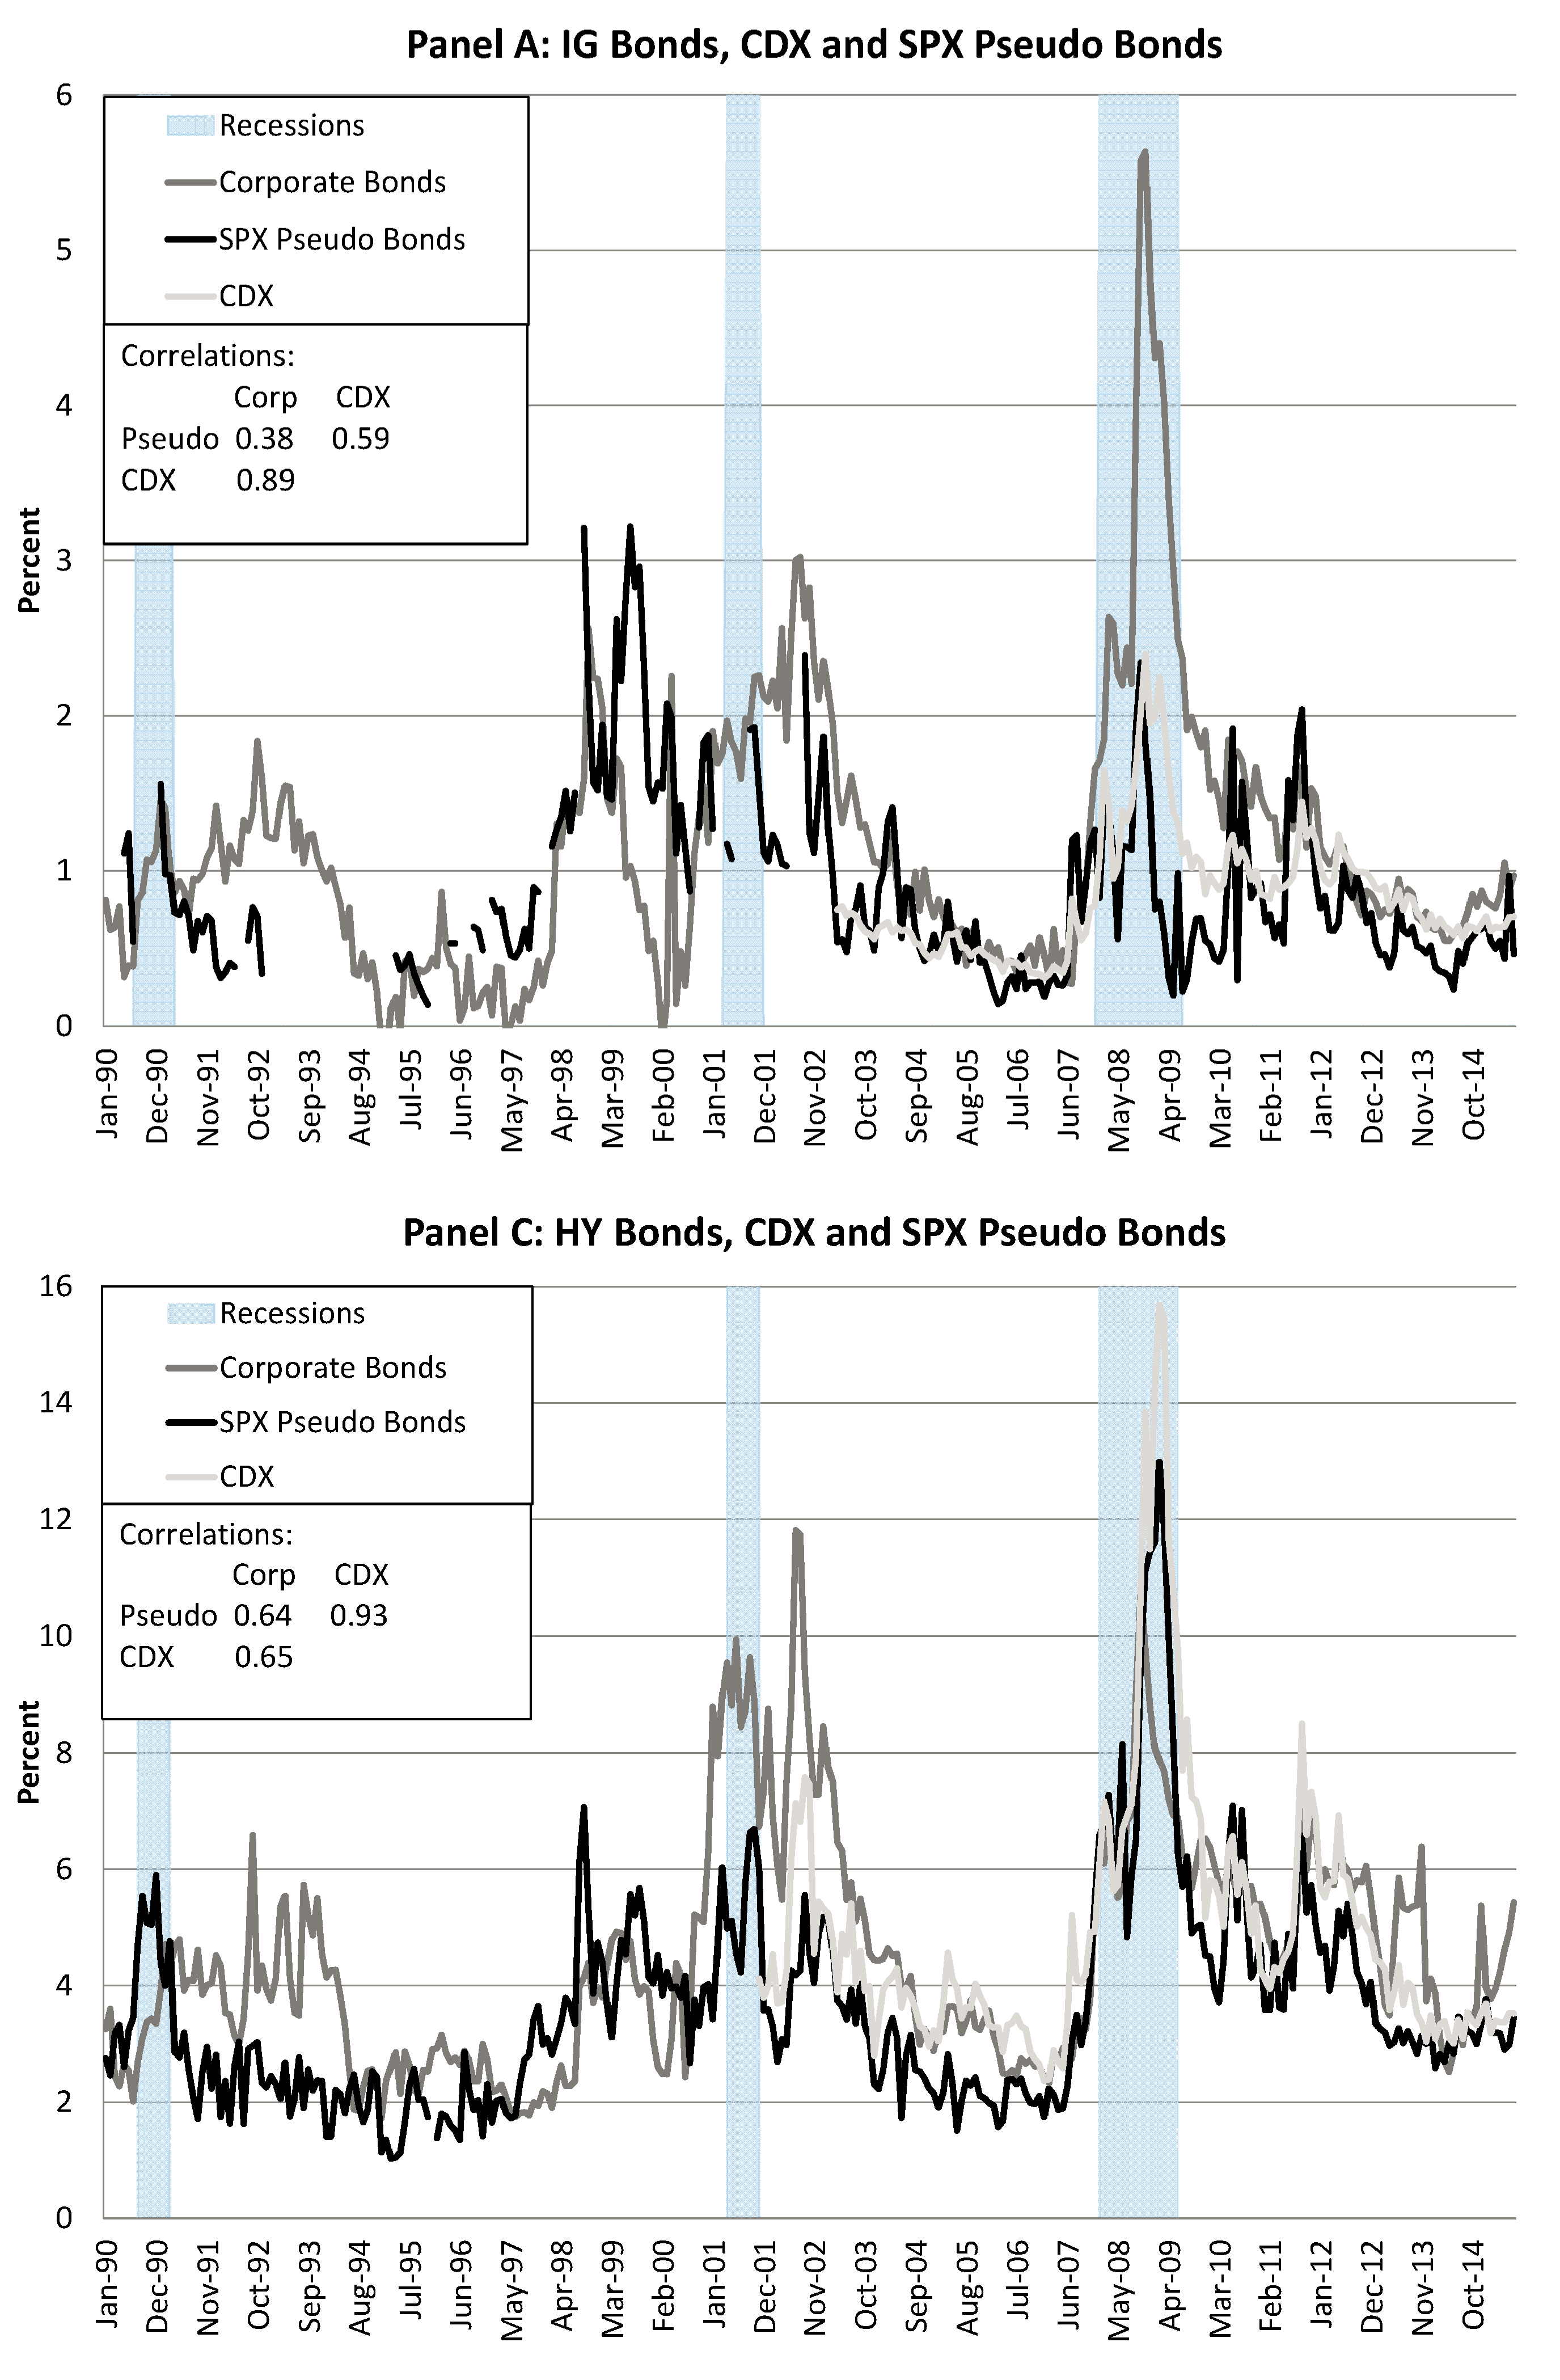
In each panel, the solid black line is the SPX-based pseudo credit spread, whereas the other lines are actual corporate bond spreads. More specifically, the dashed red line is the CDX index, while the light blue dashed-dotted line is the average corporate bond credit spread.
For both IG and HY securities, option-based credit spreads are quite similar to real corporate credit spreads. There are clearly some differences between real corporate bonds and SPX-based pseudo bonds, such as during the 2008 crisis for IG bonds and during the 2001- 2002 period for HY bonds. But these differences may in fact highlight special circumstances with the credit markets of corporate bonds. For instance, for IG firms, the CDX index was closer to SPX-based credit spreads than corporate bonds, and so it was in 2002 for HY bonds.
The correlation matrix is the followingIn particular, the correlation between HY SPX-based credit spreads and HY CDX is 92%, while with HY corporate bonds is 66%.
The available data for SPX-based pseudo bonds may be useful benchmark reference of credit spreads. Indeed, while the CDX index only starts after 2000, the SPX-based index extends back to 1990, although with some missing data in some parts of the sample.